
Technology Staffing Agency Metrics That Predict Long-Term Success

Most companies can measure hiring speed. Far fewer can measure whether the hire will still be delivering value 18 months later.
For tech and digital leadership roles (GTM leaders in SaaS, cloud platform engineering, cybersecurity, data, AI infrastructure), the cost of a mis-hire is rarely the fee. It is the opportunity cost: delayed product roadmaps, lost revenue, security exposure, and a team that stops trusting the hiring process.
That is why the most useful technology staffing agency metrics are not the ones that look good in a weekly update. They are the ones that predict long-term success.
Why “time-to-fill” is not a success metric on its own
Time-to-fill is easy to track and easy to optimise, often by narrowing the search to the most obvious candidates. The problem is that obvious is not the same as right.
Fast hiring can correlate with:
- Under-scoped role briefs (you hire a “CV”, not an outcome)
- Weak calibration across interviewers (you select for confidence, not capability)
- Low evidence standards (claims go unchecked until after start date)
Speed matters, but only when it is paired with decision quality.
What “long-term success” should mean for technology hires
Before you can measure a staffing partner, you need to define success in business terms. For senior technology and digital roles, long-term success typically includes:
- Time-to-productivity (how quickly the leader can deliver the first meaningful outcomes)
- 12-month retention (whether the person stays long enough to compound value)
- Hiring manager confidence (whether stakeholders would re-hire the same person)
- Team health and throughput (attrition, engagement, delivery cadence)
- Risk reduction in regulated contexts (data governance, security posture, audit readiness)
In other words, the metric is not “filled role”. The metric is “improved organisation”.
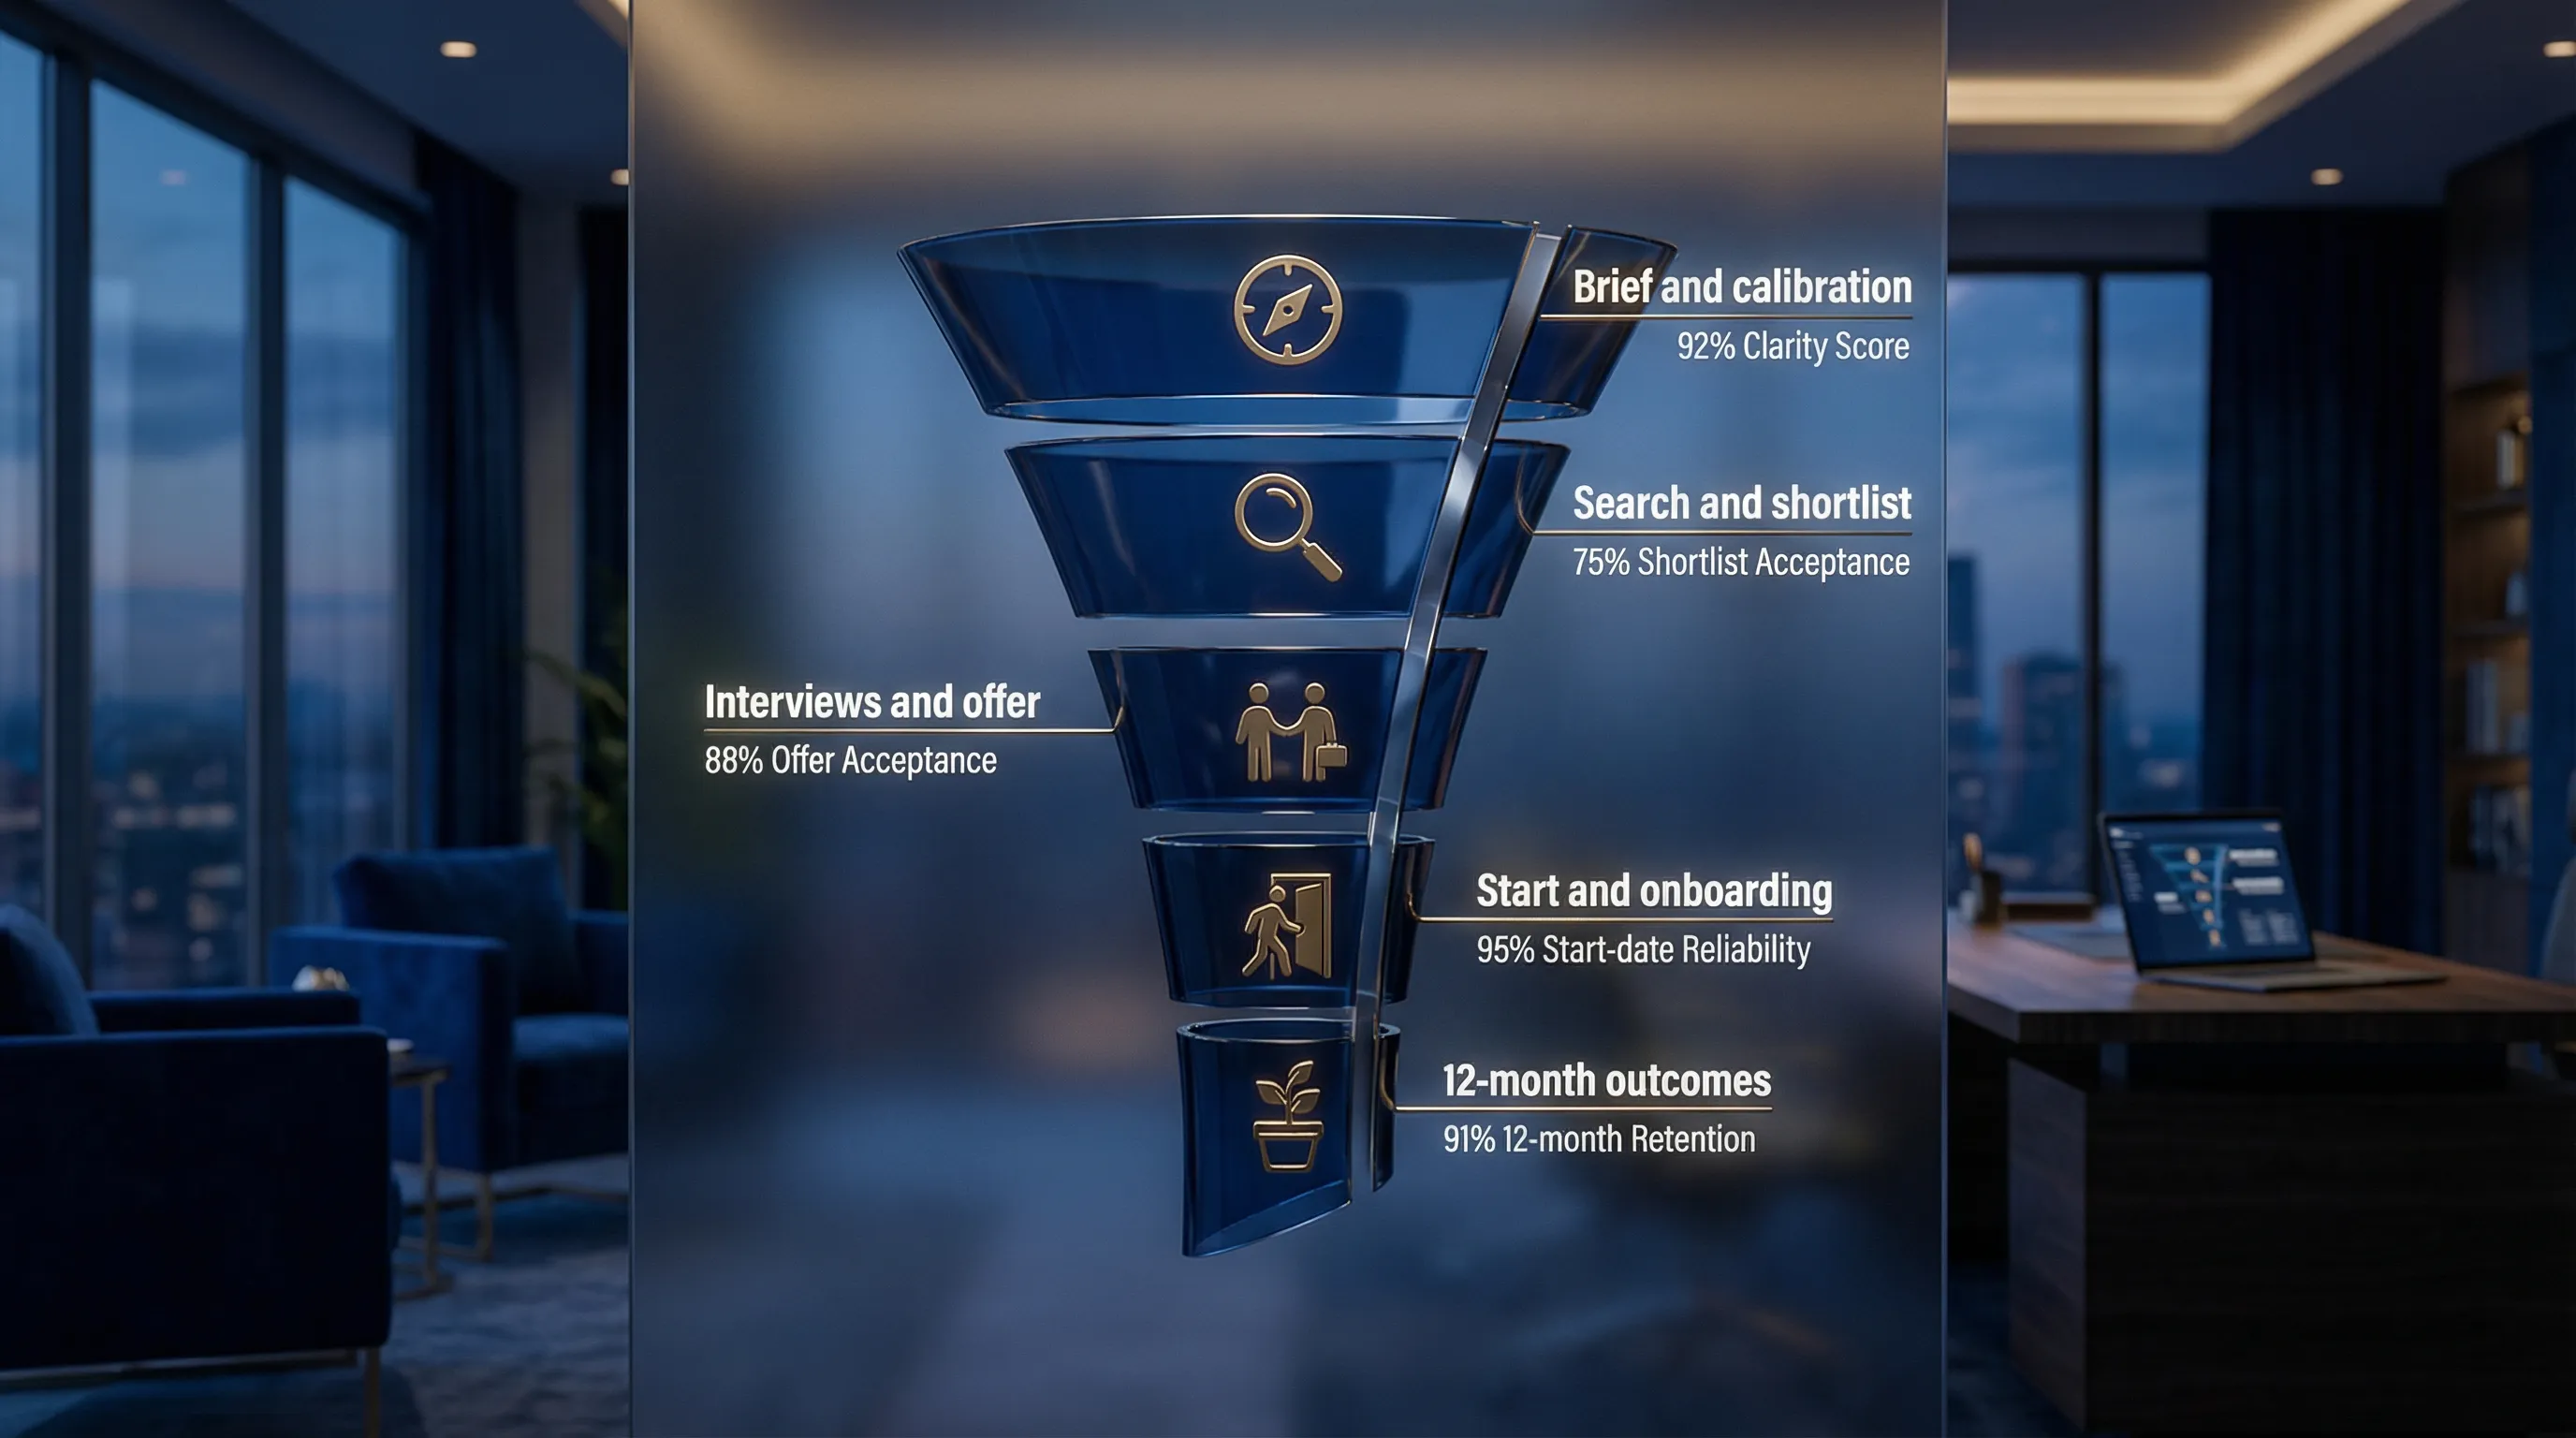
The metrics that predict long-term success (and how to use them)
1) Brief clarity score (the leading indicator most teams ignore)
If the brief is vague, every downstream metric becomes noise. Strong agencies will push for specificity and trade-offs, not just take notes.
What to measure:
- Outcome definition rate: does every role have 90-day and 12-month outcomes agreed in writing?
- Non-negotiables vs preferences: are must-haves explicitly separated from nice-to-haves?
- Stakeholder alignment time: how long it takes to get the interview panel aligned on the same success profile
What it predicts: shortlist relevance, interview consistency, and offer acceptance.
2) Search coverage ratio (are you seeing the market, or just the obvious?)
Many “shortlists” are a repackaging of candidates who are already applying elsewhere. For business-critical roles, long-term outcomes improve when the search expands into adjacent, high-signal talent pools.
What to measure:
- Target universe size: how many relevant companies and talent segments were mapped
- Passive candidate mix: what percentage of the funnel is not actively job-seeking
- Response quality: not just reply rate, but the proportion of responses that progress to a real evaluation
What it predicts: access to scarce profiles, and reduced dependency on luck.
3) Shortlist acceptance rate (the most honest “quality of shortlist” metric)
Ask a simple question: of the candidates presented, how many were credible enough that you wanted to interview them?
What to measure:
- Shortlist acceptance rate: interviews requested ÷ candidates presented
- “No” reasons taxonomy: track why candidates were rejected (scope mismatch, level mismatch, domain gaps, compensation)
What it predicts: how well the agency understood the role, and how disciplined the search really was.
4) Evidence density in candidate packs (proof beats polish in 2026)
In a market where AI can help candidates sound excellent, long-term success is correlated with verifiable evidence.
What to measure:
- Quantified outcomes per candidate: number of specific, contextualised achievements (not just percentages)
- Scope clarity: budget, team size, regions owned, decision rights
- Risk notes included: does the agency proactively surface potential concerns?
A helpful analogy is quality control in premium consumer services: some brands reduce disappointment by showing customers a preview before final production and allowing revisions. For example, PawsLife shares previews of personalised pet portraits so customers can confirm the details before delivery. In executive hiring, the equivalent is a “proof pack” that lets you validate claims early, before you commit to final rounds.
What it predicts: fewer late-stage surprises, fewer mis-hires, faster stakeholder alignment.
5) Time-in-stage (process latency) and decision hygiene
Great candidates leave slow processes. But the deeper issue is that slow processes often indicate internal misalignment.
What to measure:
- Time-in-stage by step: brief-to-shortlist, shortlist-to-interviews, final-to-offer
- Panel SLA adherence: whether interviewers meet agreed timelines
- Rework rate: how often the process “goes back a step” because criteria changed
What it predicts: offer acceptance, candidate experience, and your ability to close scarce talent.
6) Offer acceptance rate, counter-offer rate, and “deal drift”
Most companies track offer acceptance. Fewer track why offers fail and what changed.
What to measure:
- Offer acceptance rate and counter-offer incidence
- Deal drift: delta between what was discussed early (scope, comp, location, flexibility) and the final offer
- Late-stage churn causes: compensation, risk perception, manager credibility, role ambiguity
What it predicts: whether the agency is managing the close professionally, and whether your internal process is trustworthy.
7) Start-date reliability (a hidden predictor of operational maturity)
Accepted offers still fail. Start-date reliability is a practical, outcome-focused metric that catches issues in pre-boarding.
What to measure:
- Start rate: starts ÷ acceptances
- Pre-start risk flags logged: relocation friction, notice period complexity, background checks, competing processes
What it predicts: your ability to turn hiring intent into delivered capacity.
8) 90-day and 12-month success metrics (the only metrics that matter long-term)
For business-critical tech hires, you want metrics that reflect delivered outcomes, not activity.
What to measure:
- 90-day outcome attainment: were the agreed first outcomes achieved (for example, team rebuilt, platform stabilised, pipeline instrumented)
- 12-month retention and progression: still in role, promoted, expanded scope
- Hiring manager re-engagement: would the stakeholder use the same agency again for a similar hire?
What it predicts: actual organisational value creation.
If you want to make this measurable without turning it into a bureaucratic project, use a lightweight “success profile” with 3 to 5 outcomes, then review at day 90 and month 12.
A practical “predictive metrics pack” to request from your staffing partner
You do not need a dashboard to run a high-signal search. You need consistent reporting.
Ask your agency to report (weekly) on:
- Funnel numbers with context: approached, engaged, screened, presented, interviewed, progressed
- Shortlist acceptance rate and top “no” reasons
- Time-in-stage and next-step commitments (by date)
- Offer risk notes (what could derail the close)
- Market intelligence: compensation reality, candidate constraints, competitor activity
Then ask (at 90 days and 12 months) for:
- Outcome review: what was achieved, what changed, what would be done differently
This is how you turn recruitment into an improving system, not a repeating emergency.
How to use these metrics when choosing a technology staffing agency
When you are evaluating a partner, ask for evidence, not promises.
Strong signals include:
- They can show past funnel data for comparable roles (with confidentiality preserved)
- They can explain how they reduce variance in assessment (structured evaluation, calibrated referencing)
- They track post-placement outcomes, not just placements
- Their incentives align with quality (for example, policies that avoid internal behaviours that push volume over fit)
Weak signals include:
- Reporting that only highlights activity (CVs sent, calls made)
- No explicit definition of “what good looks like” in the first 90 days
- Overconfidence about timelines before role discovery is complete
Common metric traps (and what to track instead)
Trap: Counting CVs sent
A high CV count often means low calibration.
Track instead: shortlist acceptance rate and evidence density.
Trap: Optimising for interview volume
Interviews are expensive and create false momentum.
Track instead: interview-to-offer ratio with documented reasons for rejection.
Trap: Treating retention as “HR’s problem”
Retention begins in the hiring brief (scope, mandate, stakeholder alignment).
Track instead: brief clarity score, plus 90-day outcomes achieved.
Frequently Asked Questions
What is the most important metric for a technology staffing agency? The most predictive single metric is usually shortlist acceptance rate, because it reflects role understanding, search quality, and candidate relevance.
How do you measure quality of hire for senior tech roles? Use a success profile with 3 to 5 measurable outcomes, then review attainment at 90 days and reassess at 12 months alongside retention and scope progression.
What KPI best predicts offer acceptance? Process latency (time-in-stage) plus “deal drift” explain most offer failures. If role scope or flexibility changes late, acceptance drops.
Should we demand benchmarks (target percentages) from an agency? Ask for comparative data from similar searches, but treat benchmarks as directional. Your role complexity, brand strength, compensation, and urgency will shift the numbers.
How can we reduce mis-hires when candidates use AI in the process? Require evidence early (proof packs), run structured interviews, use work simulations where appropriate, and run references designed to validate specific claims rather than general opinions.
Build a hiring system that compounds (not a process you repeat)
Optima Search Europe is a specialist recruitment agency for business-critical and senior hires across Europe and globally, with deep focus across high-growth technology sectors.
If you want to apply predictive metrics to your next search, start with the success profile and funnel measurement described above. You can also speak with Optima about running a search process that prioritises evidence, alignment, and long-term outcomes.
Explore Optima Search Europe: https://www.optimaeurope.com

